> ## Documentation Index
> Fetch the complete documentation index at: https://cubed3-claude-gallant-ramanujan-hgtxbv.mintlify.site/llms.txt
> Use this file to discover all available pages before exploring further.
# Python analysis
> Attach a Python script to a report to run forecasting, regression, cohort, and other analysis that SQL can't express, and save the result as a re-runnable report.
Python analysis is currently in preview, and the user experience and file format may
still change. Reach out to the [Cube support team](/admin/account-billing/support)
to activate this feature for your account.
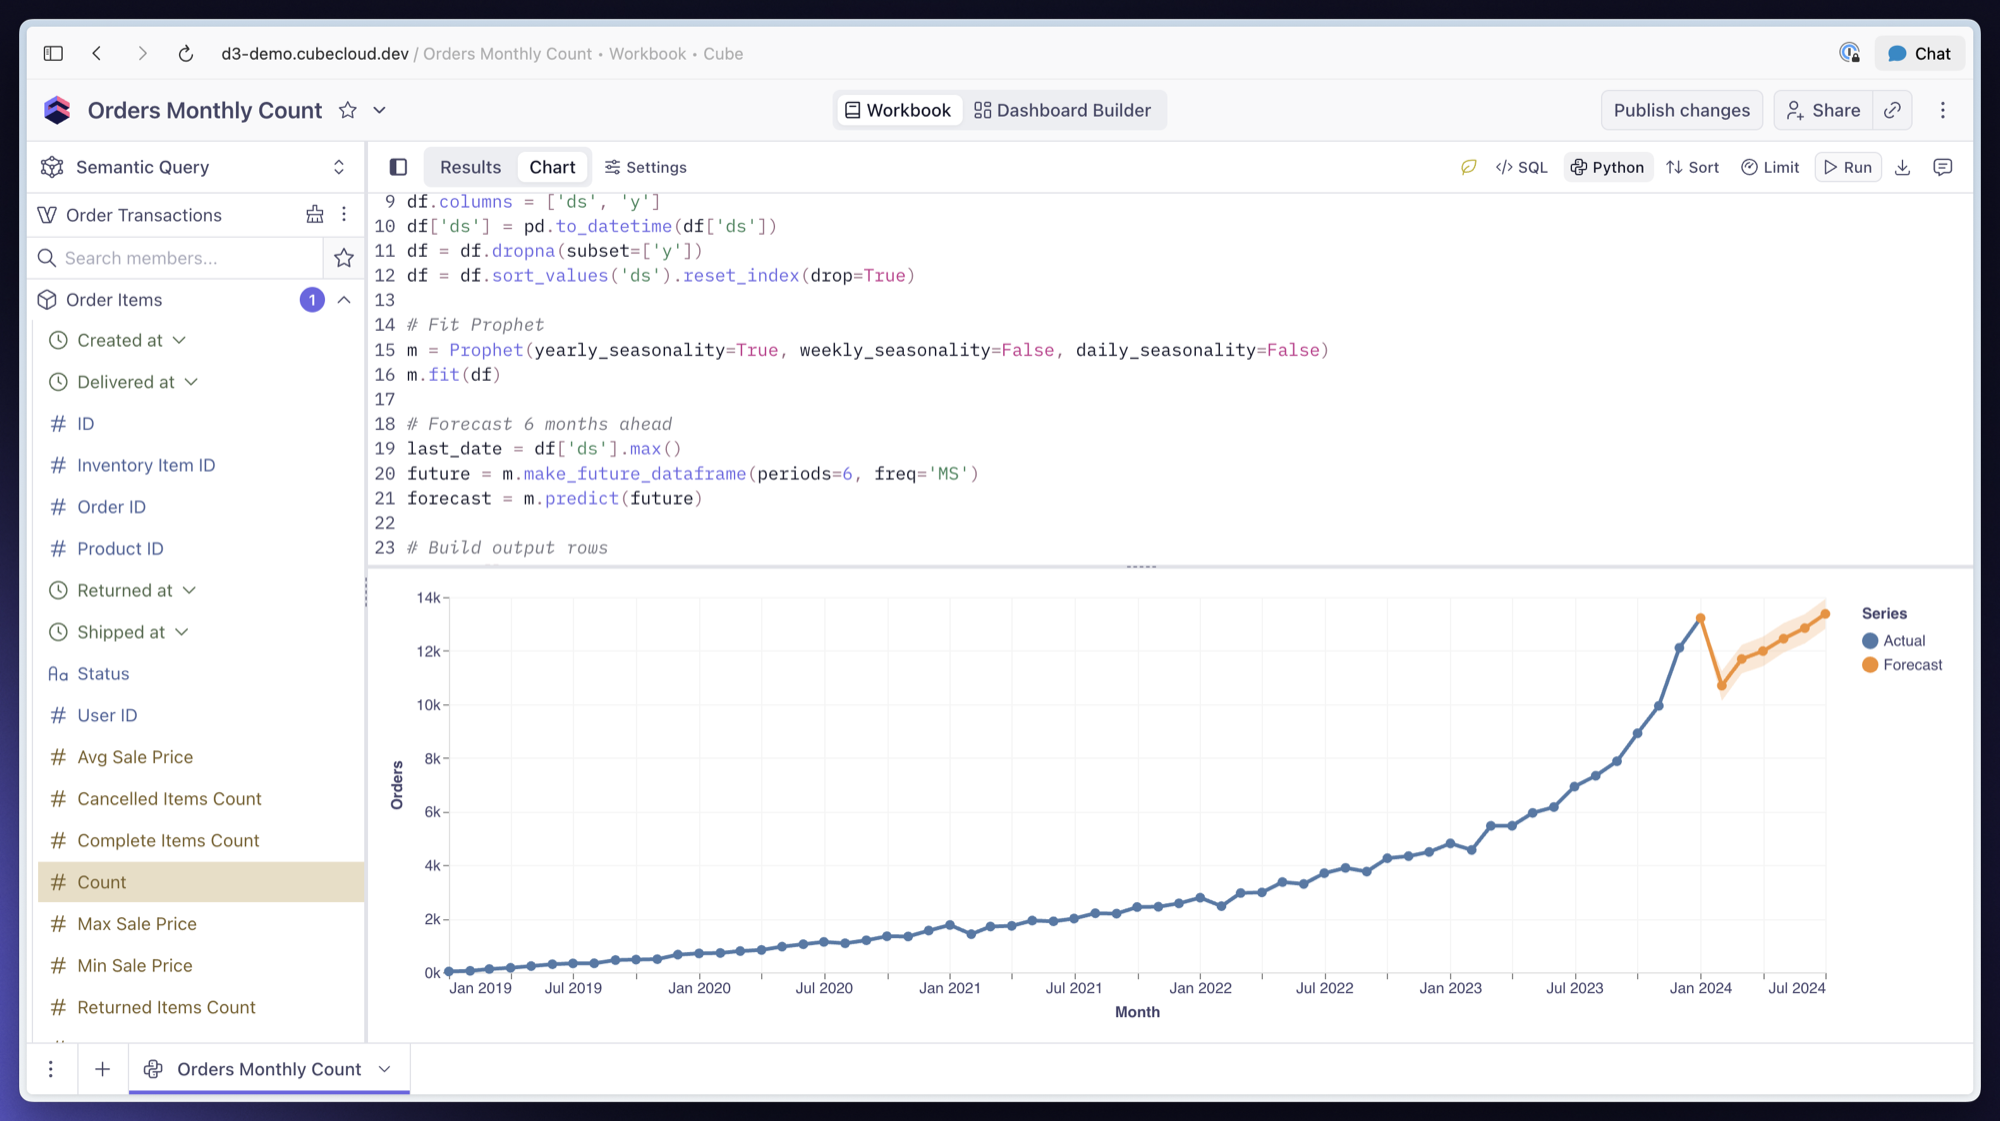
A report can carry an attached **Python script** that transforms the report's SQL
result. The report's chart then renders the script's **output** instead of the raw
SQL rows. This turns an analysis that would otherwise scroll away in a chat
transcript into a saved, re-runnable, shareable report.
Use it for work SQL can't express — forecasting, regression, cohort analysis,
statistical tests, clustering, and anomaly detection.
 ## Adding Python to a report
### From Analytics Chat
Ask for the analysis in natural language — "forecast next quarter's revenue",
"find anomalies in signups" — and the agent runs Python for you, rendering the
result inline in the [chat thread](/docs/explore-analyze/analytics-chat). This
result is ephemeral by default.
Ask to **save it to a workbook** and Cube persists both the code and the run result
onto a report, which then renders the saved output without re-running. Saving
re-executes the analysis.
The agent reaches for Python **only** when the answer genuinely needs a statistics
or machine-learning library. Ordinary aggregations, top-N, ratios, running totals,
period-over-period comparisons, and time series all stay in SQL, because a Python
run costs a re-query plus a sandbox start. If you expected Python and got a plain
SQL report, that is usually correct behavior.
### In a workbook
Open the tab menu and choose **Add Python**. Cube seeds a starter script and
reveals the code panel. **Remove Python** detaches the script, after which the tab
behaves like any SQL-backed report again.
Attaching Python clears any existing SQL result: a python-backed report renders its
last Python run, and a freshly attached script has none until you press **Run**.
### In Explore
Use the **Add Python** button in the header, with the same **Remove Python**
counterpart.
This is only available on a **saved** [exploration](/docs/explore-analyze/explore).
On an unsaved one the button is disabled with the tooltip *"Save exploration before
adding Python."* — **Run** executes server-persisted code, so the analysis needs a
saved report to live on.
## Writing the script
The script runs in a sandbox against a fixed contract:
* Input data arrives as `data.csv` in the working directory.
* Write results to `output.json` as a **flat JSON array of row objects**, for
example `[{"month": "2026-01", "value": 1.5}, ...]`.
A top-level dict or object is rejected — flatten any nested structure into one
array of uniform rows.
These libraries are available: pandas, numpy, scipy, scikit-learn, statsmodels,
prophet, matplotlib, seaborn, plotly.
## Running and refreshing
The code panel is editable in place, with line numbers.
* **Edits do not run anything.** They save with the report, and the rendered result
keeps showing the previous run.
* When the code or its input SQL has changed since the last run, the result is
marked **Outdated**, with the tooltip *"The Python code or its input SQL changed
after the last run. Run to refresh the saved result."*
* **Run** executes the stored script in the sandbox and persists the refreshed
result.
* The **input SQL panel is read-only** on a python report: that SQL is the
sandbox's input, not what gets charted.
* **A failed run keeps the previous chart.** The error and the script's
stdout/stderr surface in the UI while the last good result stays rendered.
**Run is the only way the saved result changes.** Opening the report, reloading the
page, or viewing a dashboard never re-runs anything on its own.
## On dashboards
Python reports render their **saved output** on dashboards. Nothing re-runs on
dashboard load, so an unfiltered dashboard full of Python reports costs no
compute to open — each widget shows whatever the last **Run** produced.
If the dashboard applies a filter or time granularity to a Python report, Cube
re-runs the Python analysis against the filtered SQL and shows that result
instead of the saved output. This works both in the dashboard builder and on
published, viewed dashboards. It's not yet supported on the anonymous public
embed or the signed embedded-app dashboard, which continue to show the saved
result regardless of filters.
A python widget can be opened in [Explore](/docs/explore-analyze/explore) from a
dashboard and run from there.
## Who the analysis runs as
Python runs with the **security context of the person who pressed Run** — or of the
chat user who saved the analysis. The result is then persisted on the report, and
**anyone who can view the workbook can see it**.
Row-level security is applied at **run time**, not at view time. A user with broad
access can Run, and the stored output is then readable by people whose own access
is narrower.
Take this into account when deciding who can run and publish Python reports, the
same way you would for any other saved result shared through a workbook.
## Limits
| Limit | Value |
| ----------------------------- | ------ |
| SQL query timeout | 120s |
| Python execution timeout | 120s |
| Maximum output rows persisted | 10,000 |
| Maximum output size | 2 MB |
| stdout/stderr captured | 16 KB |
Exceeding the output caps means the analysis still returns in chat but **cannot be
saved to a report**. Aggregate or summarize inside the script so the output stays
within the caps — analysis results such as forecasts, cohorts, and test statistics
are small by nature.
## Learn more
* [Analytics Chat](/docs/explore-analyze/analytics-chat) — the standalone
conversational analytics experience
* [Workbook Agent](/docs/explore-analyze/workbooks/workbook-agent) — the authoring
assistant inside a workbook
* [Source SQL tabs](/docs/explore-analyze/workbooks/source-sql-tabs) — query
connected data sources directly
## Adding Python to a report
### From Analytics Chat
Ask for the analysis in natural language — "forecast next quarter's revenue",
"find anomalies in signups" — and the agent runs Python for you, rendering the
result inline in the [chat thread](/docs/explore-analyze/analytics-chat). This
result is ephemeral by default.
Ask to **save it to a workbook** and Cube persists both the code and the run result
onto a report, which then renders the saved output without re-running. Saving
re-executes the analysis.
The agent reaches for Python **only** when the answer genuinely needs a statistics
or machine-learning library. Ordinary aggregations, top-N, ratios, running totals,
period-over-period comparisons, and time series all stay in SQL, because a Python
run costs a re-query plus a sandbox start. If you expected Python and got a plain
SQL report, that is usually correct behavior.
### In a workbook
Open the tab menu and choose **Add Python**. Cube seeds a starter script and
reveals the code panel. **Remove Python** detaches the script, after which the tab
behaves like any SQL-backed report again.
Attaching Python clears any existing SQL result: a python-backed report renders its
last Python run, and a freshly attached script has none until you press **Run**.
### In Explore
Use the **Add Python** button in the header, with the same **Remove Python**
counterpart.
This is only available on a **saved** [exploration](/docs/explore-analyze/explore).
On an unsaved one the button is disabled with the tooltip *"Save exploration before
adding Python."* — **Run** executes server-persisted code, so the analysis needs a
saved report to live on.
## Writing the script
The script runs in a sandbox against a fixed contract:
* Input data arrives as `data.csv` in the working directory.
* Write results to `output.json` as a **flat JSON array of row objects**, for
example `[{"month": "2026-01", "value": 1.5}, ...]`.
A top-level dict or object is rejected — flatten any nested structure into one
array of uniform rows.
These libraries are available: pandas, numpy, scipy, scikit-learn, statsmodels,
prophet, matplotlib, seaborn, plotly.
## Running and refreshing
The code panel is editable in place, with line numbers.
* **Edits do not run anything.** They save with the report, and the rendered result
keeps showing the previous run.
* When the code or its input SQL has changed since the last run, the result is
marked **Outdated**, with the tooltip *"The Python code or its input SQL changed
after the last run. Run to refresh the saved result."*
* **Run** executes the stored script in the sandbox and persists the refreshed
result.
* The **input SQL panel is read-only** on a python report: that SQL is the
sandbox's input, not what gets charted.
* **A failed run keeps the previous chart.** The error and the script's
stdout/stderr surface in the UI while the last good result stays rendered.
**Run is the only way the saved result changes.** Opening the report, reloading the
page, or viewing a dashboard never re-runs anything on its own.
## On dashboards
Python reports render their **saved output** on dashboards. Nothing re-runs on
dashboard load, so an unfiltered dashboard full of Python reports costs no
compute to open — each widget shows whatever the last **Run** produced.
If the dashboard applies a filter or time granularity to a Python report, Cube
re-runs the Python analysis against the filtered SQL and shows that result
instead of the saved output. This works both in the dashboard builder and on
published, viewed dashboards. It's not yet supported on the anonymous public
embed or the signed embedded-app dashboard, which continue to show the saved
result regardless of filters.
A python widget can be opened in [Explore](/docs/explore-analyze/explore) from a
dashboard and run from there.
## Who the analysis runs as
Python runs with the **security context of the person who pressed Run** — or of the
chat user who saved the analysis. The result is then persisted on the report, and
**anyone who can view the workbook can see it**.
Row-level security is applied at **run time**, not at view time. A user with broad
access can Run, and the stored output is then readable by people whose own access
is narrower.
Take this into account when deciding who can run and publish Python reports, the
same way you would for any other saved result shared through a workbook.
## Limits
| Limit | Value |
| ----------------------------- | ------ |
| SQL query timeout | 120s |
| Python execution timeout | 120s |
| Maximum output rows persisted | 10,000 |
| Maximum output size | 2 MB |
| stdout/stderr captured | 16 KB |
Exceeding the output caps means the analysis still returns in chat but **cannot be
saved to a report**. Aggregate or summarize inside the script so the output stays
within the caps — analysis results such as forecasts, cohorts, and test statistics
are small by nature.
## Learn more
* [Analytics Chat](/docs/explore-analyze/analytics-chat) — the standalone
conversational analytics experience
* [Workbook Agent](/docs/explore-analyze/workbooks/workbook-agent) — the authoring
assistant inside a workbook
* [Source SQL tabs](/docs/explore-analyze/workbooks/source-sql-tabs) — query
connected data sources directly